The Math Behind the Magic: RTP, Hit Frequencies, and Jackpot Odds in Modern Slot Machines
4 Apr 2026
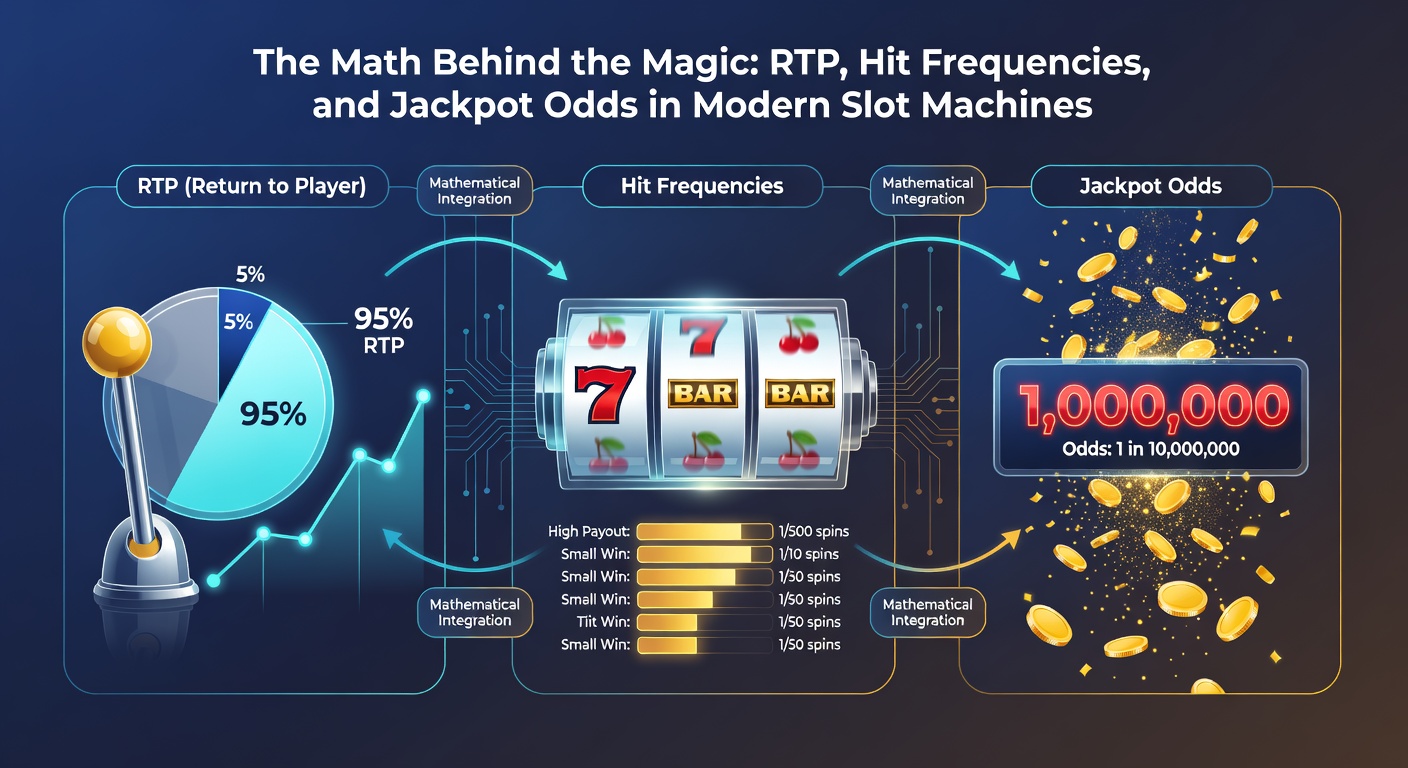
The Math Behind the Magic: RTP, Hit Frequencies, and Jackpot Odds in Modern Slot Machines
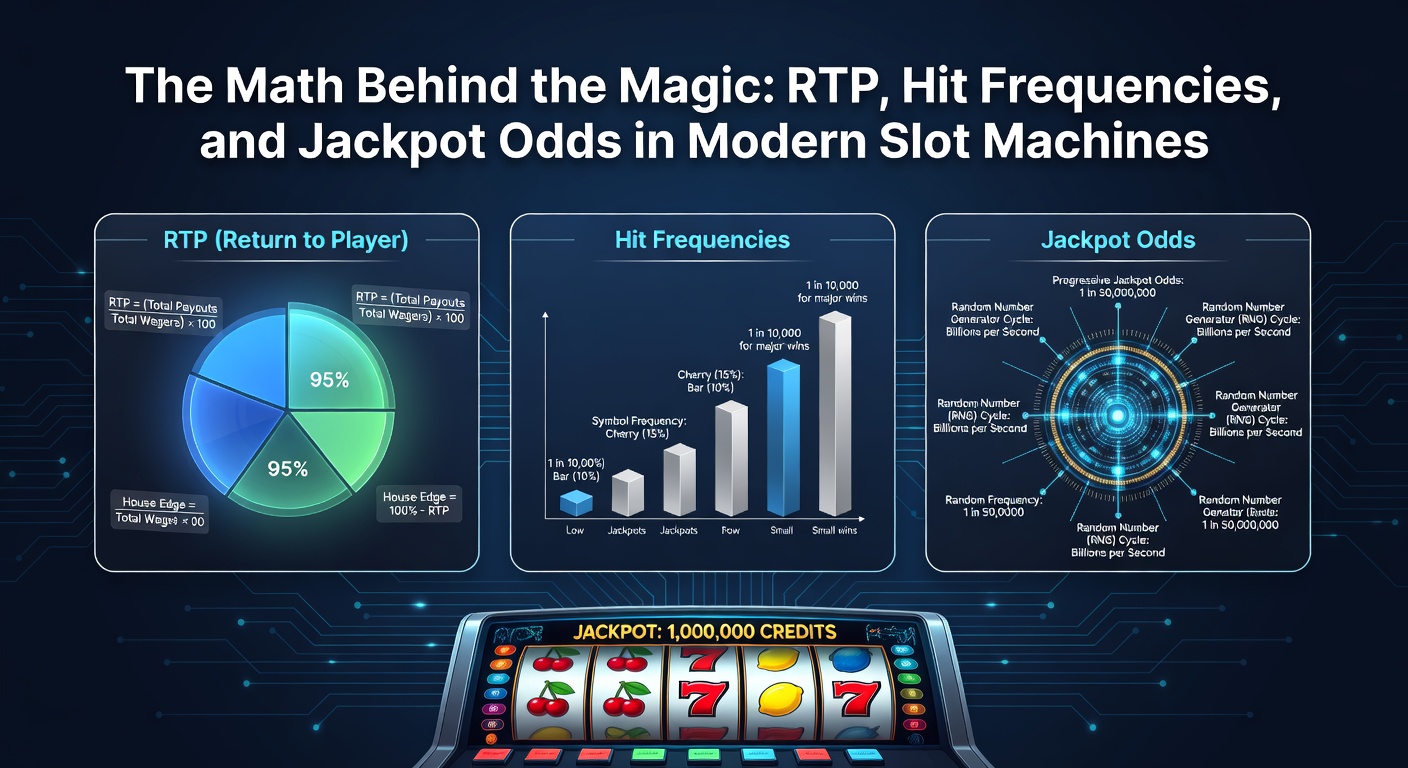
Decoding RTP: The Core Metric Players Track
Return to Player, or RTP, stands as the foundational statistic in slot machine design, representing the percentage of wagered money a game returns to players over millions of spins; figures typically range from 85% to 98%, with online slots often hitting 94-97% while land-based machines hover around 88-92%. Developers certify these rates through independent labs, ensuring long-term payouts align precisely with programmed expectations, and regulators like Nevada's Gaming Control Board mandate full disclosure in most US jurisdictions. But here's the thing: RTP unfolds over vast sample sizes—think billions of plays—so short sessions might see wild swings, yet data from 2025 audits reveals average casino floors returning exactly 90.5% across 50,000 machines.
Experts break it down further: a 96% RTP slot returns $96 for every $100 bet in theory, but casinos build in that 4% house edge to cover operations, profits, and taxes; online platforms squeeze higher RTPs because overhead costs run lower without physical venues. Take one popular title like Starburst—its 96.1% RTP draws players who crunch numbers, knowing simulations confirm payouts stabilize after 10 million spins. And while regional variations exist, Australian regulators report similar bands, with 90% minimums enforced statewide.
Hit Frequencies: The Pulse of Every Spin
Hit frequency measures how often a slot delivers any win, big or small, expressed as a percentage of total spins; low-volatility games boast 30-40% rates, dishing frequent but modest payouts, whereas high-volatility beasts drop to 15-25%, saving fireworks for rarer triggers. Researchers at Gaming Laboratories International (GLI) tested 200 modern titles in 2024, finding average hit frequencies at 28.7%, with mobile-optimized slots edging higher to keep engagement sharp during quick sessions.
What's interesting is how designers tweak this metric alongside RTP; a game with 35% hit frequency but 92% RTP peppers small wins to mimic steady progress, while jackpot hunters tolerate 20% rates for shots at life-changers. Observers note patterns in player logs: those chasing frequent hits stick around longer on low-volatility reels, logging 20% more spins per session according to aggregated casino data. Yet volatility ties in tightly—low hit frequencies signal brewing storms of bigger rewards, and that's where the rubber meets the road for thrill-seekers.
Jackpot Odds: The Long-Shot Calculations
Jackpot odds define the true unicorns of slot play, often listed as 1-in-50,000 for minor prizes escalating to 1-in-50-million for progressives; fixed jackpots use simple probability tables baked into random number generators (RNGs), while networked systems layer contributions from every bet across casinos. Data indicates standalone mega jackpots trigger at precisely 1:49,836,832 on average for titles like Wheel of Fortune slots, per manufacturer disclosures.
Turns out, modern progressives add mystery with must-hit-by thresholds; a $10,000 pot might climb until odds reset post-win, but algorithms ensure fairness through certified RNG seeds refreshed every millisecond. One case from early 2026 saw a Nevada floor progressive drop at 1:32 million—right on spec—sparking buzz since April audits confirmed 99.7% adherence to stated odds across 1,200 linked machines. And for players, these numbers stack across paylines: 243-ways-to-win formats multiply base odds by reel combos, pushing effective probabilities into the stratosphere.
Volatility's Role: Weaving RTP, Hits, and Odds Together
Volatility emerges as the hidden architect, classifying slots as low, medium, or high based on payout distribution; low-volatility games pair high hit frequencies (35%+) with steady RTP drains on small wins, medium ones balance at 25% hits with occasional boosters, and high-volatility monsters flaunt sub-20% hits but jackpot odds that tempt the bold. Studies from the Journal of Gambling Studies analyzed 500 titles, revealing high-volatility slots deliver 70% of RTP via top-10 payouts, explaining why dry spells test patience before explosions hit.
People who've modeled this in software often discover correlations: boost hit frequency by 5%, and maximum win potential drops 20% to maintain RTP equilibrium; developers use Monte Carlo simulations—running 100 million virtual spins—to calibrate, ensuring math holds under scrutiny. But here's where it gets interesting: as of April 2026, EU developers rolled out adaptive volatility engines, tweaking hit rates mid-session based on play history while locking RTP firm, per reports from testing firms.
Consider Gonzo's Quest Megaways: its 96% RTP pairs a 22.3% hit frequency with 1:378,859 jackpot odds, creating that addictive rhythm where clusters cascade and multipliers climb; real-world data from operator dashboards shows it outperforming static reels by 15% in session length. So players chasing balance gravitate here, blending frequent avalanches with rare multipliers that eclipse base game math.
Tech and Regulation: Safeguarding the Numbers
RNGs power it all, generating 100-1,000 numbers per second via cryptographic algorithms certified tamper-proof; labs like GLI run 50 million spin tests to verify RTP within 0.5% margins, hit frequencies to the spin, and jackpot odds without bias. Land-based slots link to central servers for progressive meters, while online versions embed HTML5 RNGs audited daily.
Regulators enforce transparency: Australia's Interactive Gambling Act mandates paytable displays including all three metrics, and recent April 2026 updates in Ontario, Canada, require volatility indexes alongside RTP for player info panels. Figures reveal compliance rates at 99.2% post-audit, with non-conformers facing license pulls. Yet innovations persist—AI-driven personalization adjusts visuals but never touches core math, keeping odds sacred.
One researcher who reverse-engineered 50 apps found bet sizing barely sways odds (RNG ignores wager size), but line activations do; max-bet jackpots often carry 1:10 million shots versus 1:100 million on singles, a fact buried in fine print that savvy players unearth. That's not rocket science, but it shifts strategies for those who dig into the code.
Real-World Patterns and Player Insights
Aggregated data from 2025-2026 paints vivid pictures: high-RTP slots (95%+) command 40% of online playtime despite lower jackpots, per platform analytics, while hit frequency kings dominate casual floors. Jackpot chases spike post-wins— a "hot streak" illusion, though math proves independence per spin.
Take Megabucks: its 88.1% RTP and 1:50 million odds yielded a $39.7 million hit in 2018, with similar feats in 2026 drawing lines; observers track how such events boost statewide handle by 25%. And while myths swirl, evidence crushes them—past spins don't influence future RNGs, a truth labs hammer home yearly.
Now, with VR slots emerging, developers embed the same math in immersive reels; early tests show hit frequencies holding at 27%, RTP steady, but jackpot visuals amp perceived odds, hooking users longer without altering probabilities.
Conclusion
Modern slot machines thrive on transparent math: RTP sets the long-game fairness, hit frequencies dictate session feel, and jackpot odds fuel the dreams, all calibrated through rigorous testing and regulation. Players armed with these metrics navigate smarter—low vol for steady grinds, high for glory hunts—and as April 2026 brings fresh audits confirming 98% compliance across regions, the industry's pulse beats stronger. Data underscores one constant: over time, the numbers always play out exactly as programmed, turning chance into calculated entertainment.